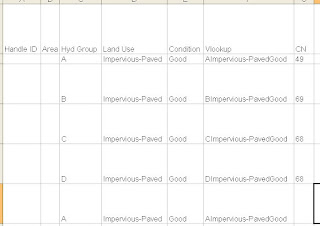
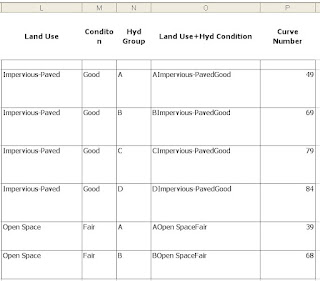
For doing TR-55 calcs, it can be a pain to lookup curve numbers for each land use/condition/hydrologic group. If you’ve already inputted that information elsewhere (see topology and excel drop down list entries for additional tips), then you can use it to your advantage in excel to automatically assign curve numbers for specified critieria. The method I’m currently using is the vlookup function. I combine columns C, D & E using the function = C1&D1&E1, then use that combined variable as the desired value for the lookup in the vlookup function. You will need to make a list with the combined three variable name assigned to
The lookup variable would be column F in this case. The table array would be columns O and P (the combined name associated with the curve number). The column index number is the value returned by excel from the table array – in this case the second column has the value that needs to be returned, so the value is 2.
Using the vlookup function, you can do a pull down of the entire function and automatically grab the curve numbers associated with the table array automatically.

